
Hey there, Habr! My name is Alexey Kolesnikov. I am a Malware Detection Specialist at the Positive Technologies Expert Security Center (PT ESC). I recently spoke at the AVAR 2023 international conference in Dubai, where I covered new plugins developed by PT ESC for an open-source dynamic malware analysis system named DRAKVUF and demonstrated how they can be used to detect current Linux threats in sandbox for protection against targeted and mass attacks PT Sandbox.
Read on for a brief overview of popular malware monitoring tools for Linux, a description of how our plugins work in DRAKVUF, and a malware analysis that relies on these plugins.
Linux monitoring tools
When it comes to collecting events from the operating system, it's important to first determine what you need it for. For example, to build EDR (Endpoint Detection and Response) or to build an analysis in an isolated environment (sandbox). Today we will focus on analysis in an isolated environment. Accordingly, when reviewing existing tools, we will adhere to this strategy.
auditd
Auditd is one of the most popular tools thanks to easy installation, simple syntax for rules, and the capability to do an analysis of system calls and file system events. Unfortunately, auditd isn’t perfect. This tool has its drawbacks:
Lack of a single message format. Any program that works with auditd can send messages in its own format. In addition, messages are transmitted as plain text in the key-value format, which isn’t as convenient as, for example, JSON
Events are not sorted by ID. For example, first there is an event with the ID 645, then 646, then 645 again. This isn’t very convenient, especially when you need to automatically parse the event stream.
Low flexibility of rules. Auditd works only via an API and gives limited access to the kernel. This is inconvenient when you need to write anything more complex than a program for intercepting system calls.
Risk of system compromise. A malicious program, after having obtained root rights, can simply turn off our logging system. In this case, our analysis system turns into a pumpkin.


inotify and fanotify
There are other tools for monitoring malicious programs in Linux. For example, inotify and fanotify, but they aren’t perfect either. Let's take a look at the inotify_event structure. You can see that it doesn’t contain any information about the process at all, so we receive an event that an action with the file system happened, and we don’t know anything about who did it. As a solution to this problem, kernel developers submit a request to use fanotify with a file descriptor and PID. However, this is not enough, since the name of the program that did the action is still unknown.


eBPF
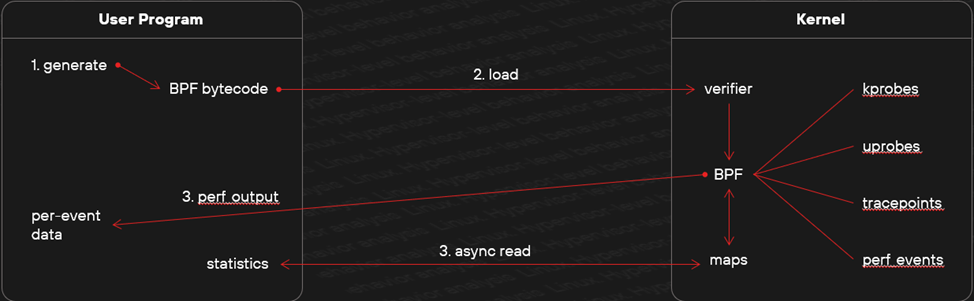
Here we can have a look at eBPF (extended Berkley Packet Filter), which came from BSD. Modern eBPF isn’t just a packet filter, but a full–fledged virtual machine that allows us to write programs in C for tasks ranging from network traffic monitoring to system performance analysis and security. Such programs communicate using BPF_MAP, which is a hashmap that is the same for both the User Space program and the Kernel Space program.
eBPF combines the functionality of auditd, inotify и fanotify. In fact, with the help of the kprobe mechanism, you can put an intercept on any kernel function, and with the help of uprobe, any function from User Space. But the limitations are still there:
Tight binding to special BPF functions called helpers;
eBPF has a guarantee for the execution time of the program, meaning there can be no cycles in the program. Well, there can be, but they’re only constant;
Limited number of instructions — 4096 for old cores up to 5.2, and up to one million in new ones.
The plugins we made
DRAKVUF is a system for dynamic analysis malicious software using the “Black Box" method. It works in conjunction with the “Xen” hypervisor, allowing you to analyze several virtual machines simultaneously in an isolated environment. Virtual machine analysis is carried out thanks to the LibVMI (Virtual Machine Introspection) component, which allows you to not only read virtual memory, but also to modify it if necessary. Thanks to this approach, you can safely run malicious code in the system and observe its behavior.
DRAKVUF is a modular system that allows you to write various plugins for kernel structures of interest. There is great flexibility in the analysis, because even if something is missing, you can always write it yourself, like we did in Positive Technologies.
Procmon
Procmon is a new plugin for DRAKVUF developed by PT ESC to track creation of new processes in a Linux system. To explain how it works, I will go over how the Linux kernel spawns a process and what information is stored within it.
To run a program, you need to call one of the functions of the exec family. However, the execve/execveat system calls don’t create a new process: they only replace the current instance of the program, replacing the stack, heap and data segments. Namely, an independent process with its own identifier creates fork/clone calls. This is a simplified diagram of how to create a new process:

The running process wants to call the whoami command. To do this, it accesses the system function from libc, then it calls fork and only after receiving a new process ID calls the execve.
The kernel stores information about all processes in the task_struct structure, which is a linked list that allows iterating over each process in the system. So, for example, by getting the address of the structure of the current process, you can access all other processes in the system. The structure is an abstraction of the process and describes all its fields. There you can get a PID (Process ID), Parent PID (PPID), information about child processes, a short name, and much more.
The next important structure needed to understand how the procmon plugin works is linux_binprm (Linux Binary Program). You can get a lot of useful information from it. For example, a pointer to a file descriptor, the name of the interpreter, and whether there was an elevation of privileges or not. The key difference for linux_binprm is purpose. Linux_binrpm stores information about process that will be created and task_struct describes a process that is already running in the system.
Procmon doesn’t actually directly intercept the execve system call, as it may seem because it contains little context about the program being run. An internal function named begin_new_exec does the intercepting. This is notable due to the fact that the function body just performs the process substitution that we expect from the execve call. Therefore, having intercepted the function at the beginning of the call, we have context about the parent process together with the linux_binprm structure, from which we can get information about the child process, and at the moment of exiting the function, the context of a newly run program.
As a demonstration of the procmon plugin, I will run two simple processes, uname and whoami on Ubuntu 20.04 with a 5.15 kernel. They contain the name of the launching process in the ProcessName field, and the ImagePathName field contains the name of the process being launched. Additionally, the command line is extracted, as well as other fields from the linux_binprm structure. From this, we can get all the necessary information about the process, and, for example, build a graph of processes.

filetracer
Now let's talk about another important plugin in DRAKVUF: filetracer. It allows you to observe events occurring in the file system. A challenge we faced while developing and testing was automatic detection of the Linux kernel version. This is because kernel version 5.12 changed the order of function parameters. We solved this by adding a special method, drakvuf_get_kernel_version, to find the current version of the kernel.
As an example of how the plugin operates, let us take a look at the handler code for the intercepted method do_truncate. Our method not only determines the kernel version but also allows arguments from the function to be correctly obtained.

As for the filetracer logic, it is much simpler than that of procmon. Yet the results are encouraging: events contain all required information about the program's activity, which helps to pass a verdict on its possible malicious behavior. So, we can use the plugin to obtain the name of the process reading the file, the file name and method used, its permissions, and its location in the system.
What else?
I described only two plugins, both of which were made by us, but there are lot more of them for DRAKVUF. And they are all aimed at getting a complete picture of the work of malicious software in the sandbox. For example, syscalls allows monitoring of system calls, and rebootmon allows monitoring of reboot events.

At the moment we have two plugins in development:
filextractor, which will allow you to extract files created during analysis. For example, if the sample downloads some payloads, we will be able to extract it from the virtual machine.
socketmon, which will allow you to monitor the network activity of programs. For example, which sites are being requested, with which data, and so on. It will be a good addition to traffic, because it will allow experts to make clear matches: which process it was and where it made the request.
How our plugins for DRAKVUF analyze malicious programs that enters in PT Sandbox
As an example, consider how they detect three common Linux families: XorDDoS, BPFDoor and Mirai. Since the analysis of malicious software takes a lot of time, we have only highlighted the main behavior that each of the presented samples does to demonstrate the work of DRAKVUF.
XorDDoS
One of XorDDoS features is the behavior: it performs a persistence to the temporary directory tmp.

On the left-hand side, you can see an event from the filetracer plugin, in which the process calls vfs_write (or just system call - write) to write a file with a random name to the temporary directory tmp. On the right-hand side, for clarity, the pseudo-code from the decompiler is shown, where you can see the direct call of the function to write the file. We have detected the persistence in tmp, which means we have discovered the malware.
BPFDoor
BPFDoor is known for installing a bpf filter on a network socket and can therefore filter network connections.

On the left is an event from the syscalls plugin. In it you can see the process name, the method, and string identifiers for the enum values SOL_SOCKET and SO_ATTACH_FILTER. On the right side, a pseudocode is shown where this action is performed directly in the BPFDoor.
Mirai
Mirai is a popular backdoor used for creating botnets. An example of its activity is covert execution of the prctl system call with the parameter PR_SET_NAME. This parameter allows modification of the process name to hide it from a network administrator inspecting the list of running processes.
To detect this activity, we need events from two DRAKVUF plugins: filetracer and syscalls. This is why I have additionally highlighted the function that the malware sample uses to write to the stdout stream.

An event received from the syscalls plugin helps to view the name of the system call (prctl) and the parameter PR_SET_NAME. The filetracer plugin helps to find the value of FileName ("/1"), while the ThreadName value is different: "/var/Sofia". The fact that all these events were initiated by the same process in the system allows matching them by IDs and making the conclusion that the process was started by Mirai.

Conclusion
Agentless behavioral analysis for Linux isn’t easy, but is still doable. The challenge is caused by lack of ready-made solutions that suited us. Thanks to this approach, we obtained greater flexibility in analysis.
All the plugins that my PT ESC coworkers and I developed are available to every DRAKVUF user. The open-source tool itself is currently under active development, so anyone can contribute to the community, making malware analysis in Linux more accessible and broadening its scope.

Alexey Kolesnikov
Malware Detection Specialist, PT ESC
